Strike tools
Future Buildup Chart: Futures Price, OI and Spot
Future Buildup in AOC is a chart of the index or stock future's price and open interest through the day, with the spot price alongside, and a table that labels each interval as long buildup, short buildup, short covering or long unwinding. It tells you whether the big money in futures agrees with what the option chain is saying.
On this page
How do I open the Future Buildup chart?
Tap the coloured spot price pill on the spot divider row of the option chain (the row that sits between the strikes at the current price). The pill shows spot or future, the day's change and the future minus spot gap, and its colour follows PCR: green above 1.2, red below 0.8, blue in between.
On the live chain, a right-click or long-press on the same pill opens an equity order instead, if order placement is on. The chart works on the live chain (AOC Pro) and in the Back Tester.
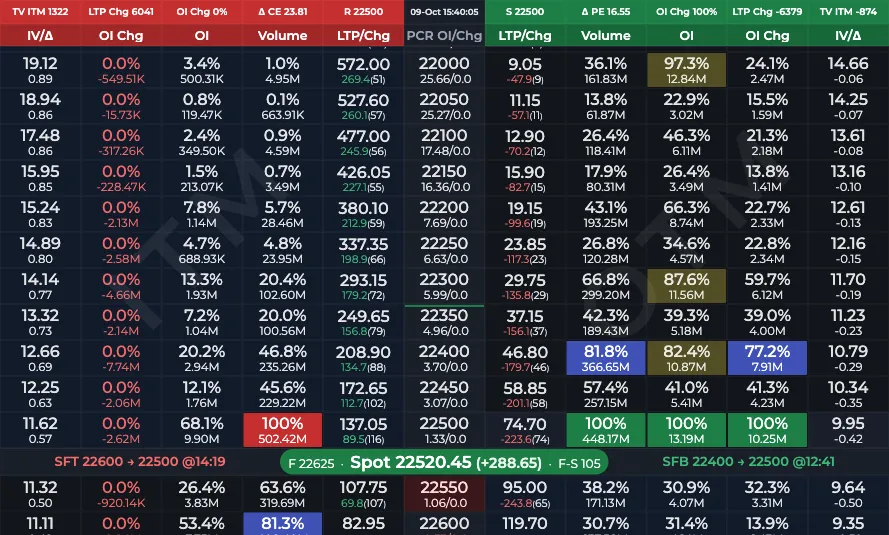
- 1Tap the spot price pill
What do the lines and colours mean?
Tap a legend chip to show or hide a line. OI follows Values in lots in Settings. On the live chain the chart refreshes every 10 seconds.
- Future Price (blue): the near-month future, on the right scale.
- Spot Price (grey): the underlying, also on the right scale; hidden by default.
- Future OI (purple): futures open interest, on the left scale.
- Future OIChng (orange): futures OI change versus the previous day, on the left scale; hidden by default.
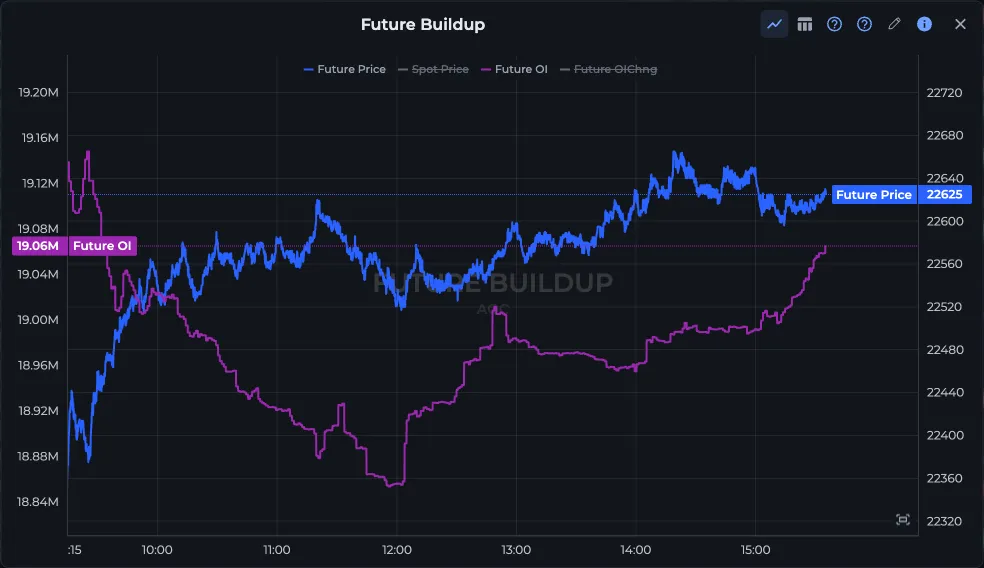
- 1Legend: Future Price, Spot Price, Future OI, Future OIChng
- 2Chart / Table switch
- 3Buildup guide explains each buildup
How does the table and the Buildup guide work?
Switch to Table with the icon in the title bar. Columns are Time, Total OI Δ (the change in futures OI from the previous row, in lots), LTP Δ (the change in future price from the previous row) and Result. Rows are sampled every 3 minutes by default; change it with the interval picker.
The ? button in the title bar opens the Buildup guide, a small reference card:
- Price up, OI up: Long Buildup, Strong Bullish, CE Buy.
- Price up, OI down: Short Covering, Weak Bullish, PE Sell.
- Price down, OI up: Short Buildup, Strong Bearish, PE Buy.
- Price down, OI down: Long Unwinding, Weak Bearish, CE Sell.
How do I read it with the option chain?
- Open Future Buildup and look at the purple OI against the blue price.
- If price and OI rise together, longs are being built in futures. Bullish signals in the chain, like support shifting up in the S/R shifting list, get more weight.
- If price rises but OI falls, it is short covering. The rally can be quick but often lacks follow-through.
- Show Spot Price to watch the basis. A future premium that collapses towards spot during a rally is a warning sign.
Worked example
NIFTY future opens at 22,560. Between 09:30 and 11:00 it climbs to 22,640 and Future OI goes from 1.38 crore to 1.46 crore. The table on 15m shows Long Buildup, Strong Bullish on most rows. The guide card points to CE Buy.
At 13:45 price slips to 22,600 and OI starts falling: Long Unwinding. The longs from the morning are booking out, so you tighten stops on calls rather than adding more.
Frequently asked questions
What is future buildup?
It is the read of futures price change against futures open interest change. Price and OI up is long buildup, price down and OI up is short buildup, price up and OI down is short covering, price and OI down is long unwinding.
Where is the future buildup chart in AOC?
Tap the coloured spot price pill on the spot divider row of the option chain. The chart opens with future price, spot, future OI and OI change.
Why is the spot price line not showing?
Spot Price and Future OIChng are hidden by default. Tap their chips in the legend to show them.
Last updated