Strike tools
Intraday Support and Resistance Shifting List
Intraday S/R Shiftings in AOC is a time-stamped list of every change in the option chain's support and resistance strikes during the day, along with the strikes holding the highest volume, OI and OI change on each side. It tells you whether the writers are moving their walls up or down, which matters more than where the walls are at any one moment.
On this page
How do I open the shifting list?
Two ways. Tap the date and time cell at the top centre of the option chain (live chain with AOC Pro, or the Back Tester) (the last-updated stamp above the strike column). Or tap one of the shift labels on the spot divider row, the coloured text either side of the spot price pill.
The labels show only when Shifting updates is on in Settings under Option chain (it is on by default). The CE side label tracks resistance and the PE side label tracks support (see support and resistance for the idea behind them).
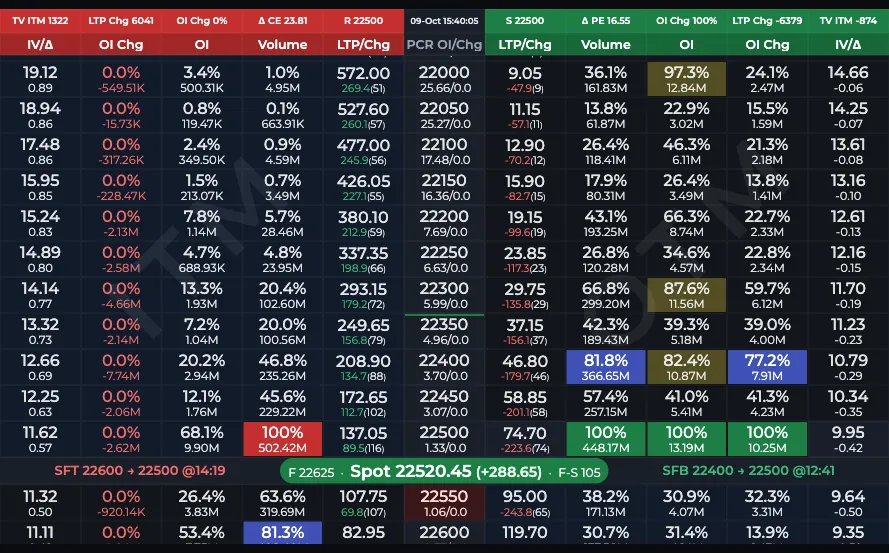
- 1Tap the date and time cell
- 2SFT label tracks resistance
- 3SFB label tracks support
What do SFT and SFB mean on the spot divider?
Each label shows the latest shift of that level, for example SFT 22600 → 22500 @10:42. SFT in red means the level moved down to a lower strike. SFB in green means it moved up to a higher strike. The time is IST. Before the first change of the day the label reads No shift yet.
Resistance coming down (red SFT on the call side) means call writers are pressing lower. Support moving up (green SFB on the put side) means put writers are getting braver.
How do I read the list?
The newest row is at the top. Columns:
- Time: when the change was recorded (hover for the date).
- Resistance (red) and Support (green): the chain's levels at that time. A ▲ or ▼ and a light tint mark the cell that changed from the row below.
- Max Vol, Max OI, Max OI Chg: the strikes with the highest volume, OI and OI change, CE on top in red and PE below in green.
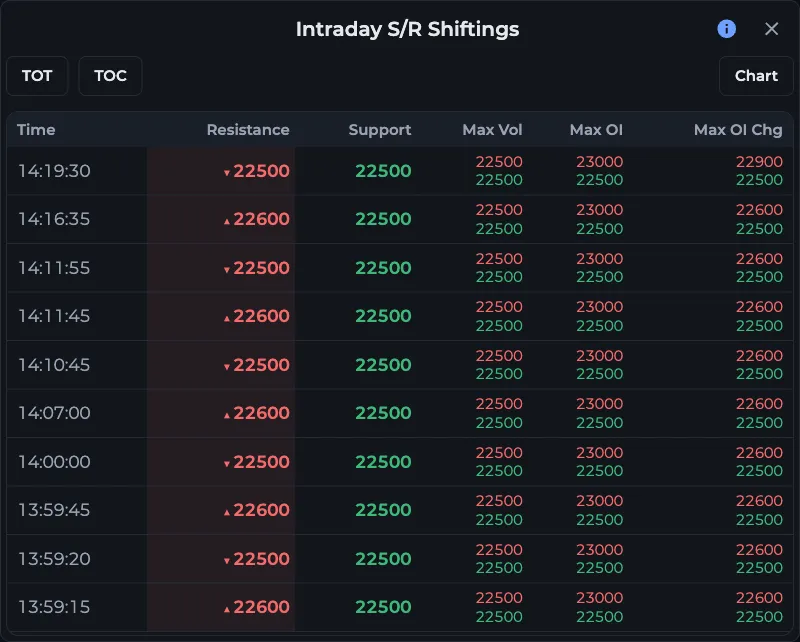
- 1TOT, TOC and Chart buttons
- 2Time of each shift
- 3Red ▼ means resistance moved down
- 4Max Vol, Max OI and Max OI Chg
What are the TOT, TOC and Chart buttons?
- TOT opens the Table of Trade: a grid of support and resistance behaviour (strong, shifting towards top, shifting towards bottom) and the trade bias for each combination.
- TOC opens the Table of Confirmation: what each combination of CE and PE OI change direction suggests, from bullish to consolidation.
- Chart opens the Intraday S/R Change Graph, which plots the max volume, max OI and max OI change strikes for CE and PE over the day so you can see the shifts as steps.
Worked example: a day when resistance kept falling
- At 09:25 the list shows Resistance 22,700 and Support 22,400 on NIFTY.
- At 10:42 a row appears with Resistance ▼ 22,600, and the call-side label turns red: SFT 22700 → 22600.
- At 11:58 resistance drops again to 22,500 while support stays at 22,400. Max OI Chg CE has moved to 22,500 too.
- Read it with TOT: resistance shifting towards the bottom against a strong support is marked Bearish, so you stop looking for call buys under 22,500.
Frequently asked questions
What does SFT mean in the AOC option chain?
SFT, shown in red beside the spot price, means support or resistance has shifted down to a lower strike. SFB, in green, means it shifted up to a higher strike. The label shows the old strike, the new one and the IST time.
Why can't I see the shifting labels on the spot row?
Shifting updates is switched off. Turn it on in Settings under Option chain. You can still open the full list by tapping the time cell at the top centre of the chain.
How is support and resistance decided for the shifting list?
The list records the same support and resistance strikes the chain shows as S and R in its header, which AOC derives from the strikes with the heaviest call and put open interest activity. Each row is logged when one of them changes.
Last updated