Strike tools
CE and PE Buildup Chart: OI and OI Change of a Strike
CE BuildUp and PE BuildUp in AOC are the strike-level charts that put an option's price next to its open interest and OI change, and a table that labels each interval as Long Buildup, Short Buildup, Short Covering or Long Unwinding. They answer the question every chain reader has: is this OI being written or bought?
On this page
How do I open the CE or PE buildup chart?
Tap the OI Chg cell of a strike. That opens the OI Charts pop-up for the strike, which has nine tabs: OI Chng, VOI, Cross OI, PCR, OI, CE BuildUp, PE BuildUp, COI% and Volume. Pick CE BuildUp or PE BuildUp.
To open straight on a buildup tab every time, set Settings, OI Charts, Default chart to CE BuildUp or PE BuildUp, or turn on Remember last chart. Like the other strike pop-ups it needs the live chain (AOC Pro) or the Back Tester.
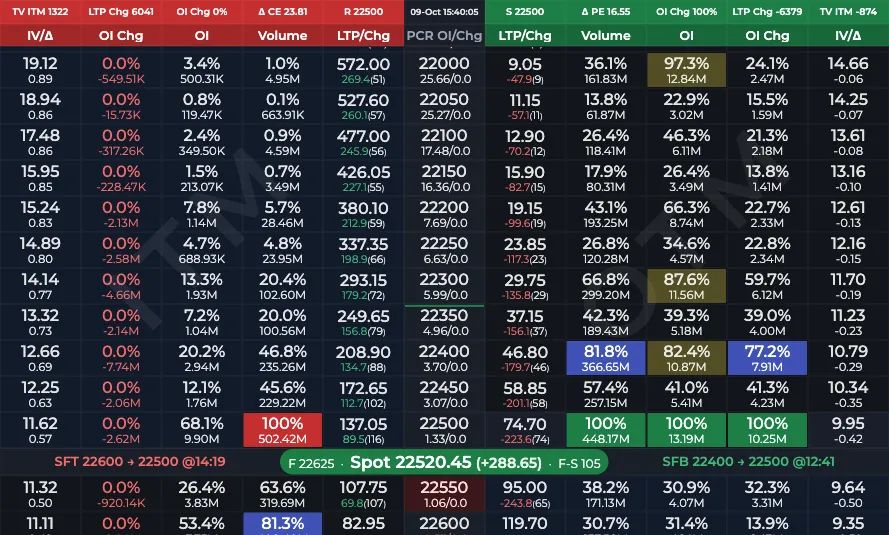
- 1Tap the CE OI Chg cell
- 2Or tap the PE OI Chg cell
What do the lines and colours mean?
OI values follow Values in lots in Settings. On the live chain the chart adds new data every 10 seconds.
- OI Chng (purple): the option's change in open interest since the previous day, on the right scale.
- OI (amber): total open interest, hidden until you tap its chip.
- LTP (blue): the option premium, on the left scale.
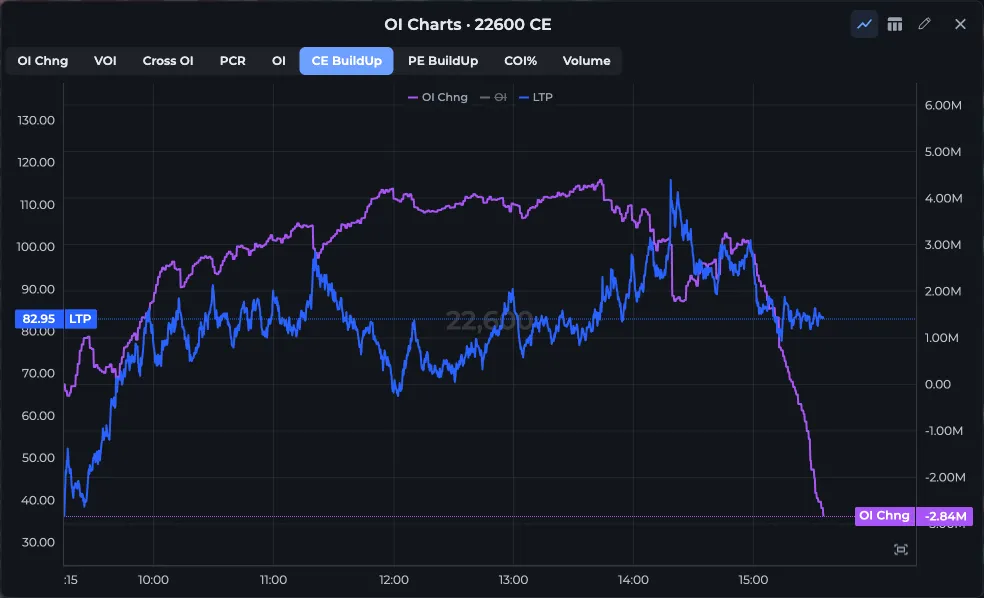
- 1CE BuildUp and PE BuildUp tabs
- 2Legend: OI Chng, OI, LTP
- 3Chart / Table switch
How does the buildup table work?
Switch to Table with the icon in the title bar. Each row is a sample (every 3 minutes by default; the interval picker goes from 30s to 15m). Total OI Δ and LTP Δ are the changes from the previous row, and Result combines them:
- Price up, OI up: Long Buildup, Strong Bullish.
- Price up, OI down: Short Covering, Weak Bullish.
- Price down, OI up: Short Buildup, Strong Bearish.
- Price down, OI down: Long Unwinding, Weak Bearish.
What does bullish mean for a call versus a put?
The labels describe the option itself, not the index. Short Buildup on the 22,600 CE means call writers are adding positions while the call falls: bearish for NIFTY, resistance getting stronger. Short Buildup on the 22,400 PE is the opposite: put writers adding, support getting stronger, bullish for NIFTY. Read more on OI buildup.
Worked example on the 22,600 CE
- Tap the 22,600 CE OI Chg cell and open CE BuildUp.
- From 10:00 to 11:30 the purple OI Chng line climbs from 12 lakh to 41 lakh while the blue LTP slides from 64 to 38.
- Switch to Table on 15m. Most rows read Short Buildup, Strong Bearish.
- Call writers are building a wall at 22,600. You avoid buying calls below it and look at the Percentage Graph to see if 22,600 is becoming the chain's top resistance.
Frequently asked questions
What is long buildup and short buildup in options?
Long buildup is price and open interest both rising, meaning new buyers. Short buildup is price falling while OI rises, meaning new writers. AOC labels each interval of a strike's CE or PE this way in the buildup table.
Where is the CE buildup chart in AOC?
Tap a strike's OI Chg cell in the option chain to open OI Charts, then choose the CE BuildUp or PE BuildUp tab. You can make it the default tab in Settings under OI Charts.
Why is the OI line missing from the buildup chart?
Total OI is hidden by default so the OI change line is easier to read. Tap the OI chip in the legend to show it.
Is short buildup in a put bearish?
No. Short buildup in a put means put writers are adding positions as the put loses value, which supports the underlying. It is bearish for the put buyer and bullish for the index.
Last updated