Stock screeners
S/R Stocks: F&O Stocks at Option Chain Support
S/R Stocks is the AOC screener that lists F&O stocks whose price has come very close to their option chain support or resistance, time-stamped through the session. In practice it is a watchlist of stocks sitting on a level, so you open only the chains worth reading instead of scrolling through all of them.
On this page
How does a stock get on the S/R Stocks list?
Every time AOC processes a stock's option chain, it works out that stock's support and resistance first. On the put side it looks at three strikes: the one with the highest OI, the highest volume and the highest OI change. Whichever of the three sits closest to the current price is the support. The call side does the same for resistance. The support and resistance glossary entry explains why writers defend these strikes.
Each of those strikes also has a reversal price (shown in the chain's Rev LTP/Spot column). If the stock's price is very close to the reversal price at the support strike, the stock goes on the Support list. If it is very close to the reversal price at the resistance strike instead, it goes on Resistance.
Example: HDFCBANK trades at 1,652 and its support reversal price is 1,651.30. Price is sitting right on that level, so HDFCBANK lands in the Support column with the time of that reading.
How often does the list refresh?
The page asks the server for fresh rows every 30 seconds while the tab is visible. It pauses when you switch to another tab and picks up again when you come back. Rows already on screen stay put during a refresh, so your scroll position does not jump.
On the server side, a stock is added to the same column at most once every 10 minutes. If RELIANCE keeps hugging support from 10:05 to 10:40, you will see a few separate signals, not one every few seconds.
How do I read a row?
The tab labels show how many stocks are in each column, e.g. Support (14) and Resistance (9). On a phone the two columns are tabs; on a wide screen they sit side by side.
- Stock name, and a ×N badge when the stock has signalled more than once that day. Tap the badge to expand every signal time.
- Signal time in IST plus how long ago it was, e.g. "10:42 · 6m ago".
- The day's price and change, with a green or red trend arrow.
- Live opens that stock's live option chain. Historical opens the Back Tester at the exact date, expiry and time of the signal.
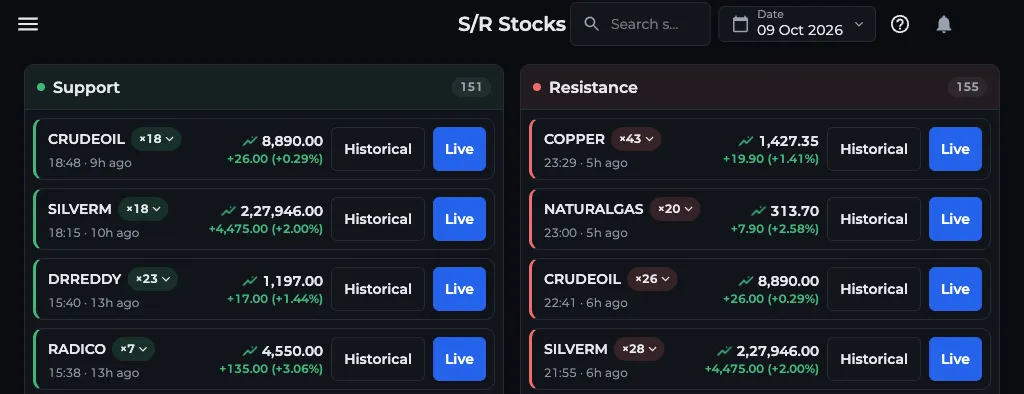
- 1Support column with its count
- 2×N badge: tap to see every signal
- 3Historical opens the Back Tester
- 4Live opens the option chain
- 5Date picker for past sessions
How do I shortlist a trade with S/R Stocks?
- Open S/R Stocks from the Stock Screener menu. It loads today's date by default.
- Pick the column that matches your idea: Support for a bounce long, Resistance for a rejection short.
- Prefer fresh signals (a few minutes old) and stocks with a ×2 or ×3 badge that keep returning to the level.
- Tap Live to open the stock's option chain and check that the support strike still has the heaviest put writing and the OI change is not flipping against you.
- Plan your entry, stop below the reversal price (or above it for a short) and your quantity on the chain before placing anything with your broker.
Can I check past days?
Yes. The Date picker lists every past session that has S/R data, newest first. Pick one to see that day's full list. Historical on any row then replays the chain at the signal time, which is the quickest way to study how a level actually played out.
What are the limits?
S/R Stocks is analysis, not a buy or sell recommendation. Needs AOC Pro (see pricing).
- Being at support is not the same as support holding. Plenty of stocks touch support and break it.
- A row is a snapshot: it does not disappear if the stock later breaks down, and nothing tells you whether the trade would have worked.
- There is no entry, target or stop-loss on the list. You set those on the chain.
- A stock can show up in both columns on the same day as price travels.
Frequently asked questions
What does S/R Stocks show in AOC Calculator?
It lists F&O stocks whose price is very close to the reversal price at their option chain support or resistance strike. Each row shows the signal time in IST, the day's price and change, and buttons to open the live chain or replay the chain at that moment.
How is support decided for each stock?
AOC takes the put strikes with the highest OI, highest volume and highest OI change, and picks the one closest to the current price. Resistance is picked the same way from the call side.
Is S/R Stocks free?
No. You need to log in with an AOC Pro plan or higher. Free users see a prompt to upgrade on the page.
Why does the same stock appear several times?
A stock can signal again 10 minutes or more after its last signal on the same side. AOC groups these under one row with a ×N badge; tap it to see every signal time.
Last updated