Strike tools
Reversal Chart: Track a Strike's Support and Resistance
The Reversal Chart in AOC plots, minute by minute, the call and put premium gap that decides a strike's support or resistance reversal price. When the line crosses zero, the underlying is sitting exactly on that reversal level, so intraday traders use it to time bounces and breakouts at a strike.
On this page
Where is the Reversal Chart?
Tap the CE IV/Δ cell of a strike (the call side). The pop-up title reads Reversal Chart · 22500. It loads three strikes at once: the one you tapped and its neighbours above and below, so give it a second.
On the live chain (AOC Pro) it refreshes every 10 seconds. In the Back Tester it shows the day up to the replayed moment.
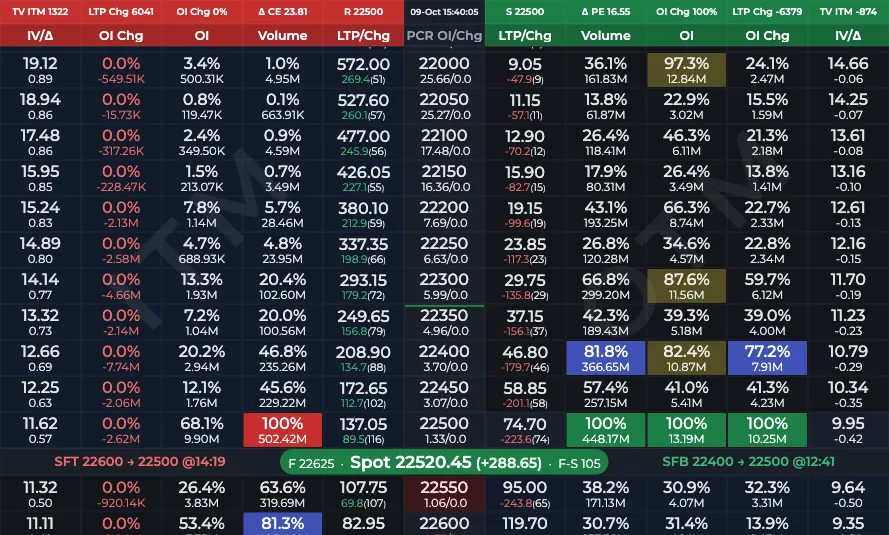
- 1Tap the CE IV/Δ cell
What do the two tabs show?
Both tabs draw a flat grey line at zero, labelled Support or Resistance, and the coloured Reversal line around it.
- From Support: the call minus put premium gap behind the strike's support (EOS). The line is green.
- From Resistance: the call minus put premium gap behind the strike's resistance (EOR). The line is red.
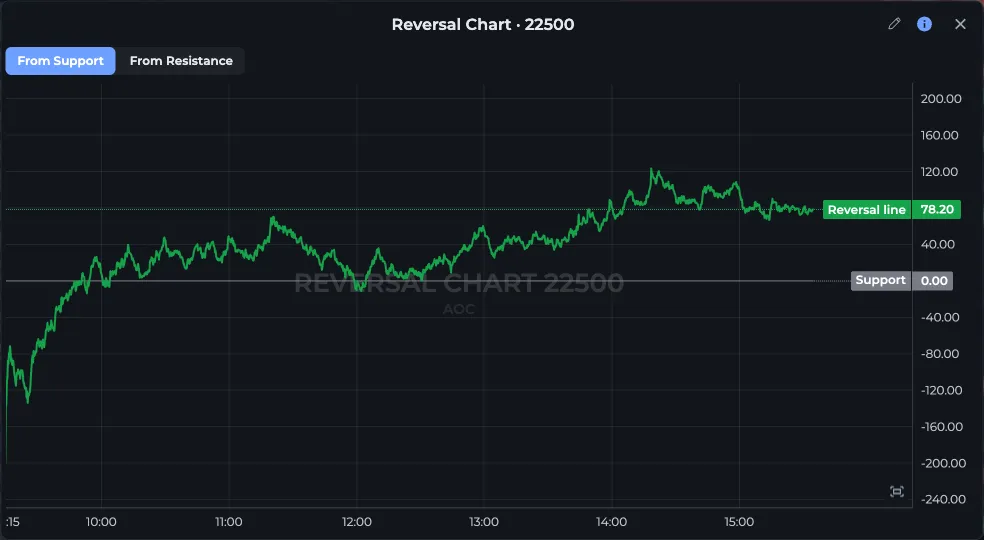
- 1From Support tab: green reversal line
- 2From Resistance tab: red line
- 3Pencil: drawing tools
How do I read the reversal line?
Zero means the two premiums are equal, and that is the definition of the reversal price on the strike S/R pop-up. So the line is really a gauge of where spot is against the level.
On From Support, above zero means the call is richer than the put: spot is above support. A drop through zero means spot has broken below that support. On From Resistance, below zero means the put is richer: spot is under resistance. A cross above zero is the breakout.
Watch the slope as much as the value. A line falling steadily towards zero on From Support tells you the cushion above support is shrinking even before it breaks.
How do I use it for a trade?
- Find the red-tinted in-range strike in the chain, for example 22,500.
- Tap its CE IV/Δ cell and stay on From Support.
- If the line comes down close to zero and turns back up, support held: that is the bounce a call buyer waits for.
- Switch to From Resistance. If the line climbs to zero and rolls over, resistance held. If it crosses and stays above, expect extension towards the next strike.
Worked example
NIFTY trades at 22,530 at 11:00. On the 22,500 strike, From Support reads +38 (22,500 CE at 112, 22,450 PE at 74). By 12:15 spot slips to 22,470 and the line is at +6. At 12:40 it touches minus 2 and by 13:05 is back at +21 with spot at 22,515.
Support at 22,500 was tested and held. A call bought on the turn at 12:40 had a defined level to exit below: a sustained move under zero.
Frequently asked questions
What is a reversal chart in options?
In AOC it is a line of the premium difference that defines a strike's support or resistance: the strike CE minus the lower strike PE for support, the upper strike CE minus this strike PE for resistance. It crosses zero when the underlying is exactly at that reversal price.
Which cell opens the reversal chart?
The IV/Δ cell on the call (CE) side of the strike. The same cell on the put side opens the Combined Price Chart instead.
Why does the reversal chart keep loading?
It needs data for three strikes: the tapped one and its neighbours above and below. Until all three have data, it shows a loader, then No data with a Retry button.
Last updated