Strike tools
Combined Price Chart: Straddle Premium of a Strike
The Combined Price Chart in AOC plots the sum of a strike's call and put premiums, which is its straddle price, along with the CE and PE lines for the day. Option sellers watch it to see whether the strike's premium is decaying, and buyers watch it for the jump that comes before a big move.
On this page
How do I open the Combined Price Chart?
Tap the PE IV/Δ cell of a strike (the put side). The pop-up title reads Combined Price Chart · 22500. The same cell on the call side opens the Reversal Chart.
Like every strike pop-up, it opens from the live chain (AOC Pro) or the replayed chain in the Back Tester. On the live chain it refreshes every 10 seconds.
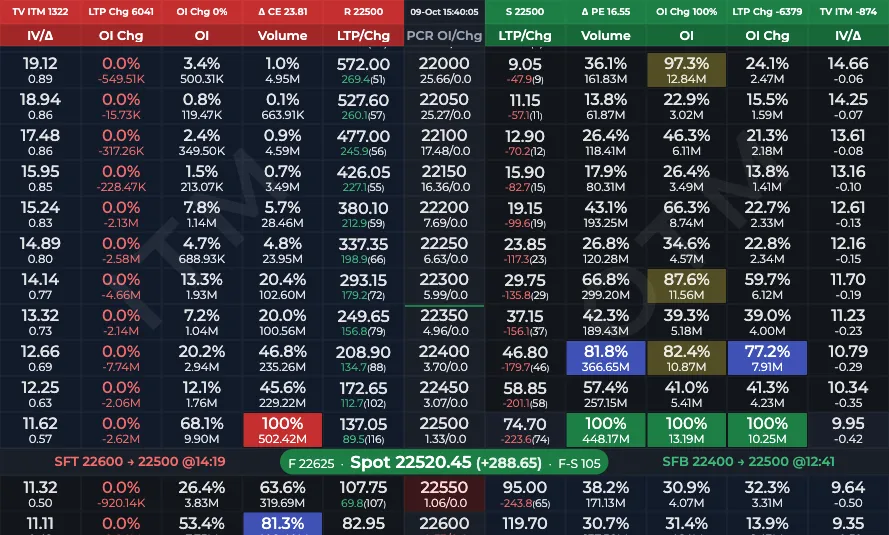
- 1Tap the PE IV/Δ cell
What do the lines and colours mean?
Tap a legend chip to hide or show its line. Hiding CE and PE leaves just the straddle, which is the cleanest way to read decay.
- Sum (blue): CE LTP plus PE LTP of the strike. This is the straddle premium.
- CE (green): the call premium.
- PE (red): the put premium.
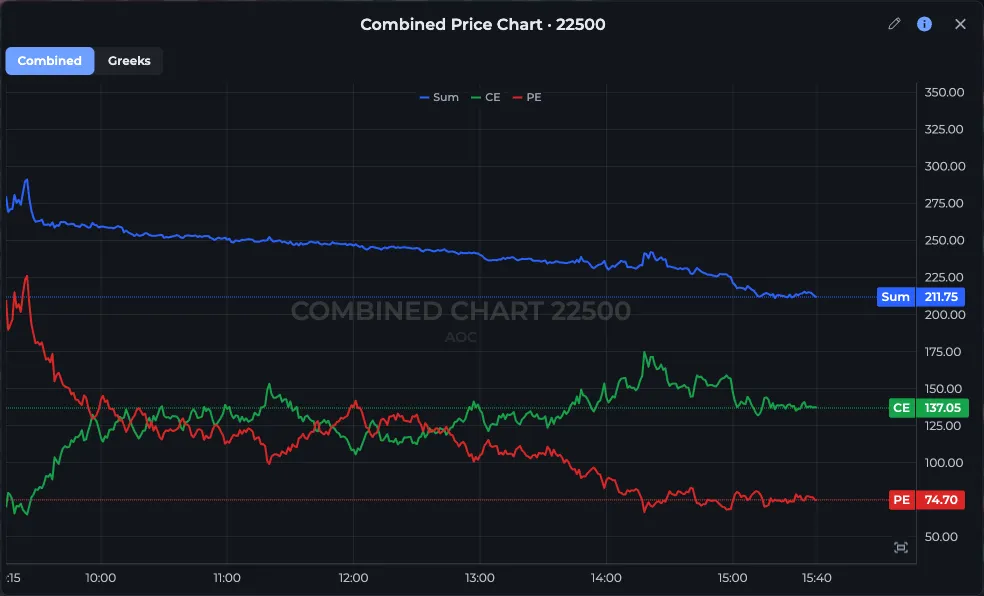
- 1Combined and Greeks tabs
- 2Legend: Sum (straddle), CE and PE
- 3Pencil: drawing tools
What is on the Greeks tab?
Switch from Combined to Greeks and you get the same strike's greeks over the day, with tabs IV, Delta, Gamma, Theta and Vega. Each shows a CE line, a PE line and the CE minus PE difference. It is the per-strike version of the Greeks chart. Gamma is multiplied by 1,000 so it is readable.
How do I read the straddle line?
- Note the Sum at the open, say after 09:20.
- Check its slope. A steady fall while spot stays near the strike is time decay at work; short straddle and strangle sellers are winning.
- Watch for a sharp rise in Sum. If one leg rises much faster than the other falls, the market is moving away from the strike. If both legs rise together, implied volatility is going up.
- Use the CE and PE lines to see which side is driving it.
Worked example: expiry morning
On a NIFTY expiry, the 22,500 straddle opens at 168 at 09:20 (CE 86, PE 82) with spot at 22,505. By 11:30 Sum is 121 and spot is still within 25 points. Sellers are fine.
At 13:10 Sum jumps from 104 to 139 in fifteen minutes: PE goes from 50 to 104 while CE falls only from 54 to 35. That is a sharp move down through the strike, and the cue for a short straddle to adjust.
Frequently asked questions
What is a combined price chart?
It is a chart of a strike's call premium plus its put premium over the day, which is the straddle price, shown with the separate CE and PE lines. In AOC it opens from the put side IV/Δ cell.
How do I know if the straddle is decaying?
Hide the CE and PE lines and look at Sum. If it trends down while spot stays near the strike, premium is decaying. A rising Sum means either a directional move or rising IV.
Can I see greeks for a single strike?
Yes. Open the Combined Price Chart for that strike and switch to the Greeks tab for IV, Delta, Gamma, Theta and Vega of its call and put through the day.
Last updated