Strike tools
Greeks Chart: Delta, Gamma, Theta, Vega and IV
The Greeks chart in AOC plots the summed Delta, Gamma, Theta, Vega and IV of calls and puts around the chain's support and resistance through the day, with the CE minus PE difference. It shows how option risk is shifting during the session, which a single snapshot of greeks cannot.
On this page
Where do I find the Greeks chart?
It opens from the live option chain (AOC Pro) or the replayed chain in the Back Tester:
- Δ CE or Δ PE in the chain header: opens the Greeks Graph for the whole chain.
- Greeks heading of the Greeks table below the chain: opens the same graph. The table shows only when Greeks table is on in Settings under Option chain (on by default).
- For one strike: tap the PE IV/Δ cell to open the Combined Price Chart and switch to its Greeks tab.
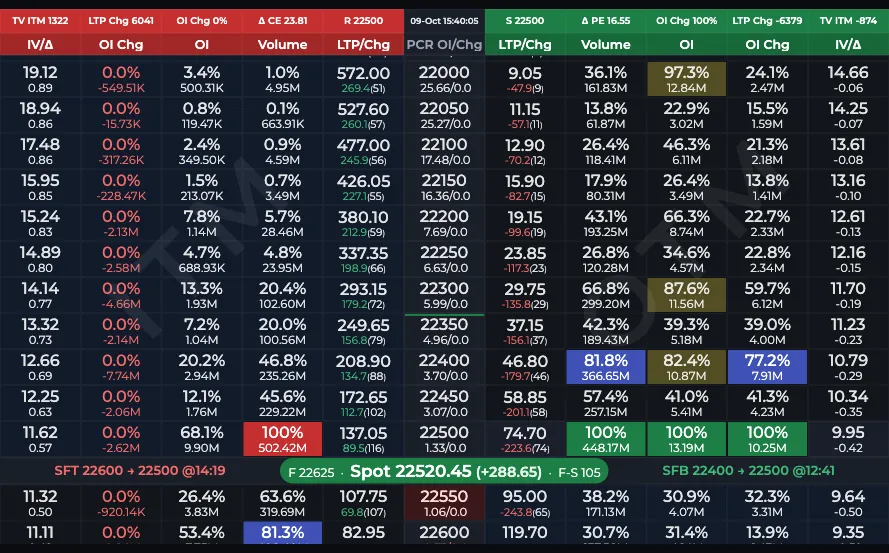
- 1Δ CE opens the Greeks Graph
- 2Δ PE opens the same graph
What do the tabs and lines show?
The chain graph has tabs Delta, Gamma, Theta, Vega and IV (the per-strike version starts with IV). Each tab draws a green CE line (red on Theta), a red PE line (green on Theta), a blue CE minus PE line and a dashed grey Zero line. Tap a legend chip to hide a line. On the live chain it refreshes every 10 seconds.
Chain values are sums over the strikes in the band around support and resistance. Gamma is multiplied by 1,000 so it reads as a normal number. Put delta is negative, so the PE delta line sits below zero.
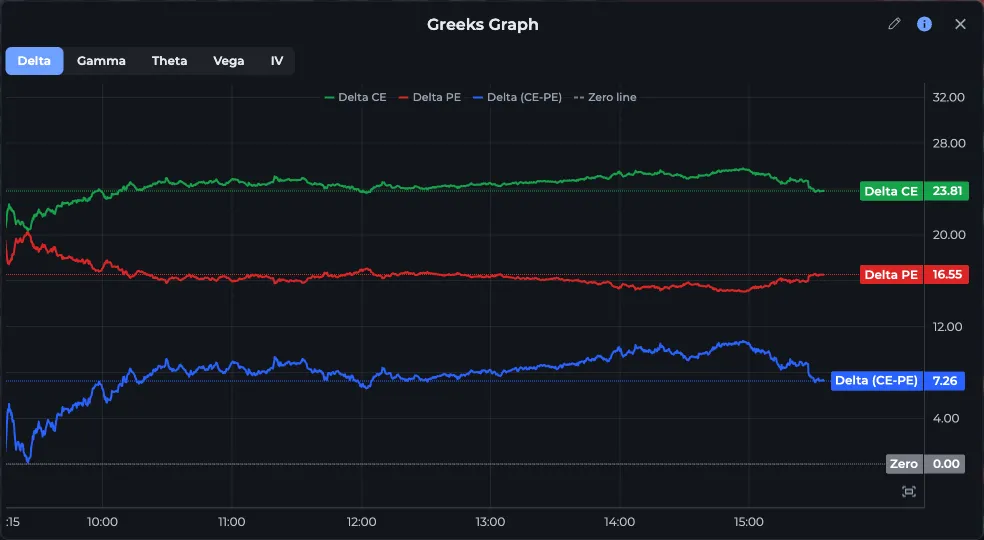
- 1Tabs: Delta, Gamma, Theta, Vega, IV
- 2Legend: CE, PE and CE minus PE
What is in the Greeks table?
Rows IV, Delta, Vega, Gamma (times 1,000) and Theta, columns Call, Put and Diff (call minus put, green when positive, red when negative). It is the current snapshot of what the graph plots over time. Learn what each greek measures in option greeks.
How do I read the Greeks chart?
- Start on Delta. Call delta rising and put delta getting more negative at the same time usually means the market moved to lower strikes; the reverse means it moved up.
- Check IV. Put IV climbing faster than call IV is demand for downside protection.
- On Theta, a growing gap shows which side is paying more decay; it speeds up into expiry.
- Use Gamma on expiry day. A jump means at-the-money options have become very sensitive, and premiums can swing hard on small moves.
Worked example
NIFTY at 10:00: header shows Δ CE 3.12 and Δ PE minus 1.94. By 14:00 it is 2.41 and minus 2.63. Call delta is shrinking and put delta growing: the band of strikes has drifted to where puts are closer to the money, which matches a slide from 22,560 to 22,470.
On the IV tab the PE line rose from 98 to 109 while CE stayed flat. Put buyers are paying for protection, so a put you sell today carries more risk than its premium suggests.
Frequently asked questions
How do I see option greeks over time in AOC?
Tap Δ CE or Δ PE in the option chain header, or the Greeks heading of the table below the chain. The Greeks Graph shows Delta, Gamma, Theta, Vega and IV for calls and puts through the day.
Why is gamma multiplied by 1000?
Raw gamma values are tiny decimals. Multiplying by 1,000 makes the line and the table readable without changing the shape of the chart.
Can I see the greeks of one strike?
Yes. Tap the PE side IV/Δ cell of the strike to open the Combined Price Chart, then pick the Greeks tab.
Why is the Greeks table missing below the chain?
It is turned off. Switch on Greeks table in Settings under Option chain. The header Δ cells still open the graph either way.
Last updated