Charts and strategies
Chart Drawing Tools: Trend Lines, Fib and Positions
Chart drawing tools in AOC are the TradingView-style tools behind the pencil icon on a chart: trend lines, Fib retracement, rectangles, text, price range, long and short position and more. You use them to mark levels, measure moves and plan a trade's stop and target right on the option chain charts and in Multi Charts.
On this page
Where are the drawing tools?
Look for the pencil icon. In Multi Charts and the split-screen charts it sits in the chart's header. On the pop-up charts you open from the option chain it sits in the pop-up's title bar, or at the top left of the chart. Tap it to open the Drawing Tools panel.
Drawing tools work wherever that chart works, so they follow the same plan access as the chart itself. Some full-page graphs do not have the pencil.
Which drawing tools are there?
Seventeen, listed alphabetically in the panel:
- Lines: Horizontal line, Horizontal ray, Vertical line, Cross line, Trend line, Ray, Extended line and Arrow.
- Shapes and channels: Parallel channel, Rectangle and Circle.
- Measuring: Fib retracement and Price range (shows the move in points and percent between two prices).
- Notes: Text and Callout.
- Trade planning: Long position (green) and Short position (red).
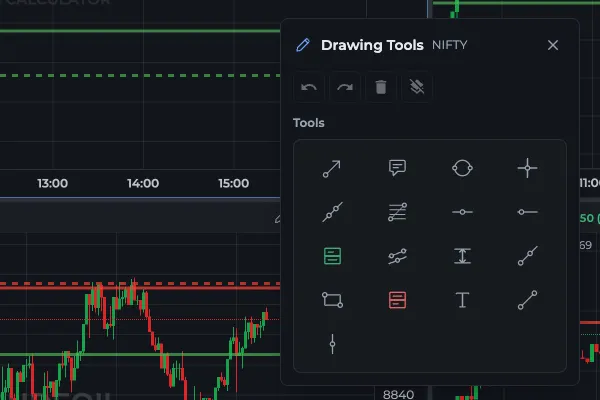
- 1Undo and Redo
- 2Delete selected drawing
- 3Clear all drawings
- 4Trend line tool
- 5Long position tool
How do I draw and edit a line?
Changed your mind before placing it? Open the panel and press Cancel drawing. The panel also has Undo, Redo, Delete selected and Clear all drawings. Undo keeps up to 50 steps per chart.
Lock on the selection toolbar stops a drawing from being moved or deleted by accident. Press Unlock to edit it again. The bin icon deletes the selected drawing.
- Tap the pencil to open Drawing Tools.
- Pick a tool. The panel closes and the tool stays armed.
- Click (or tap) on the chart for each point the tool needs. A trend line takes two points, a horizontal line one.
- Click the finished drawing to select it. A small toolbar appears at the top of the chart.
- Change Color, Line width (1 to 4 px) or Line style (Solid, Dashed, Dotted) there, or open Settings for everything else.
What is in the drawing settings dialog?
Open it with the gear on the selection toolbar, or just double-click a drawing. Changes show on the chart as you make them. Ok keeps them, Cancel puts the drawing back as it was. The tabs depend on the tool:
- Style: colour, width and style of the line, plus tool-specific options. Trend lines get line ends (Normal or Arrow), Extend, Middle point, Price labels and Stats (price range, percent change, bars range, date / time range, distance, angle). Fib retracement lets you edit each level's value and colour, use one colour, reverse, show prices or levels as values or percents, and set the label position. Rectangles and circles get a border, a middle line and a background with opacity.
- Text: a label for lines, channels and rectangles, with colour, font size, bold, italic and alignment. For the Text and Callout tools this is where you type, with background, border and text wrap options. Placing a Text drawing opens this tab straight away.
- Coordinates: the price of each point, which you can type in exactly (say 22,480 instead of dragging to it), with its time shown next to it.
- Inputs (long and short position only): Account size, Lot size, Risk %, Entry price, Profit price and Stop price.
How does the long and short position tool work?
Place a Long position or Short position at your entry. AOC starts every new position at 1:2 risk-reward: the target is twice as far from the entry as the stop. Drag the target or stop zone to adjust, or type the prices in the Inputs tab.
Example: a long on BANKNIFTY spot at 52,000 with a 100-point stop starts with the target at 52,200. The Style tab sets the profit and stop colours, text, Compact stats mode and Price labels.
How does price range work on a chart with two axes?
Some option chain charts plot two things on two scales, for example price on the right and open interest on the left. Draw a Price range there and you get the usual label for the main axis, plus a second label at the start of the range with the same move in the other axis's units: its start value, end value, the change and the change in percent. That lets you read, say, how much OI was added while the premium moved from 120 to 150.
Where are my drawings saved?
In your browser, per chart. Each chart has its own key built from the chart and the instrument (symbol, instrument type and strike), so drawings on NIFTY 22,500 CE stay on that strike and do not show up on 22,600 CE. They reload the next time you open the same chart in the same browser.
They are not synced to your AOC account. Clearing site data, a private window, or another device or browser starts with no drawings.
Frequently asked questions
Does AOC have Fibonacci retracement on its charts?
Yes. Fib retracement is in the drawing tools behind the pencil icon. Its settings let you edit each level's value and colour, reverse it, and show levels as values or percents.
Why did my chart drawings disappear?
Drawings are saved in your browser, not your AOC account. A different browser or device, a private window, or clearing site data will show the chart without them. They also belong to one instrument, so switching to another strike shows that strike's drawings.
How do I change the risk-reward on the long position tool?
Drag the target or stop zone on the chart, or double-click the drawing and type the Profit price and Stop price in the Inputs tab. New positions start at 1:2.
Is there undo for chart drawings?
Yes. The Drawing Tools panel has Undo and Redo buttons that keep up to 50 steps for each chart.
Last updated