OI graphs and back testing
All Volume Bar Graphs: Option Volume by Strike
All Volume Bar Graphs is the AOC page that plots traded volume for every strike of the live option chain as bars, with tabs for raw volume, volume % and the volume leaders on each side. Use it to see where the day's trading is concentrated, which often shows the range traders are playing before OI catches up.
On this page
Where do I find the volume bar chart?
Menu, then Charts & Graphs, then All Volume Bar Graphs, or open it as a tab in Tabbed AOC.
It needs a login and an active AOC plan (AOC Pro or higher); see pricing. The controls are the same as All OI Bar Graphs: symbol search and AI in the top bar, Spot readout and marker, a Strikes selector (20, 40 by default, 60 or All), legend chips, hover or tap for values, and zoom or pan on the chart.
What does each volume tab show?
- Volume: Vol PE (green), Vol CE (red) and Vol PE-CE (blue) for each strike, the total contracts traded today.
- Volume %: Vol% PE, Vol% CE and Vol% PE-CE. Each side's volume as a percentage of that side's busiest strike, so the busiest call and the busiest put both read 100%.
- Leaders: one stacked bar per side. PE Highest is solid green and PE 2nd is blue; CE Highest is solid red and CE 2nd is yellow. Every other strike is a faded bar (Volume PE, Volume CE), so the top two strikes on each side stand out at a glance.
How do I read the Leaders tab?
Example: BANKNIFTY spot is 55,180. PE Highest is 55,000 and PE 2nd is 54,500. CE Highest is 55,500 and CE 2nd is 56,000. Most of today's trading is happening between 55,000 and 55,500, with the market in the lower half of that band.
If later the CE Highest bar jumps from 55,500 to 55,300, call activity has moved closer to price. Check whether OI followed on All OI Bar Graphs before reading it as new resistance.
- Open All Volume Bar Graphs and pick the symbol.
- Switch to the Leaders tab.
- Find the solid green and blue bars: the highest and second-highest put volume strikes.
- Find the solid red and yellow bars: the highest and second-highest call volume strikes.
- Compare them with the Spot marker to see where the market sits between the two busiest zones.
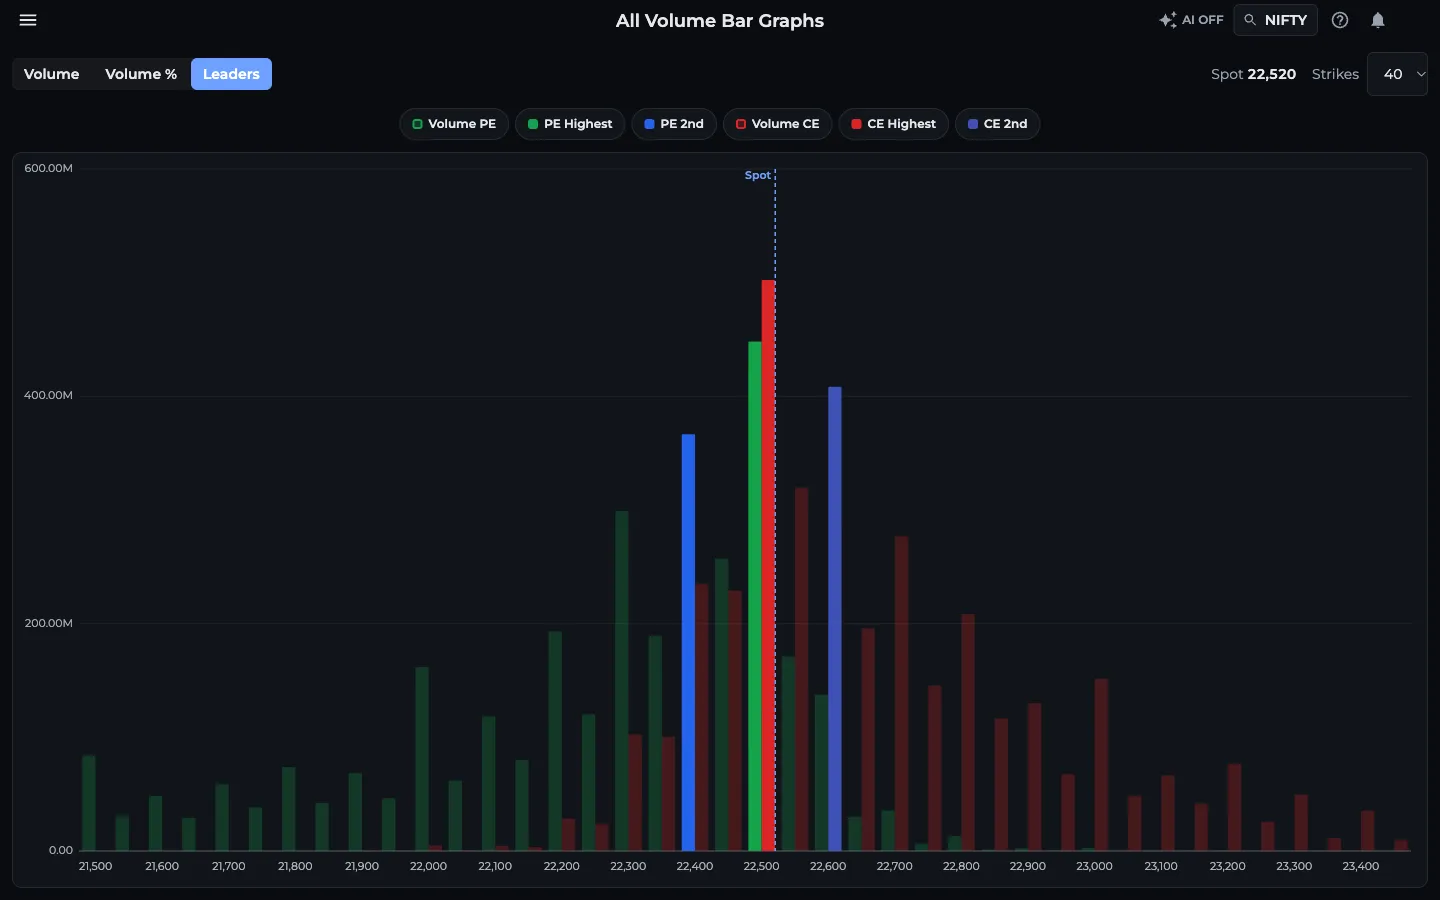
- 1Tabs: Volume, Volume %, Leaders
- 2Legend: PE Highest, PE 2nd, CE Highest, CE 2nd
- 3Spot price readout
- 4Strikes: 20, 40, 60 or All
Volume or OI: which should I trust?
Volume shows where contracts changed hands today. Open interest shows what is still held. A strike can trade a huge volume with little OI change when traders are buying and selling the same contracts within the day.
Use volume to spot where attention is, then confirm with OI change. When both point at the same strike, that level carries more weight. For how volume % moves through the day for a few strikes, use Multi Percentage Graphs.
Frequently asked questions
What does Volume % mean in AOC?
Volume % is a strike's traded volume as a percentage of the busiest strike on the same side. The most traded call strike reads 100% for calls, and the most traded put strike reads 100% for puts.
What do the colours on the Leaders tab mean?
Solid green is the highest put volume strike and blue the second highest. Solid red is the highest call volume strike and yellow the second highest. All other strikes are faded bars of their side's colour.
Is there a past-date version of the volume bars?
No. All Volume Bar Graphs shows the live option chain only. OI Graphs Replay covers OI, OI change, Combined and GEX bars for past sessions, but not volume.
Last updated