Market data
Global Markets: World Indices, GIFT Nifty and Heatmap
Global Markets in AOC is a world indices dashboard: 65 major indices from the US, Asia, Europe and beyond, grouped by market, with GIFT Nifty and NIFTY futures side by side at the top. Indian traders open it before 09:15 IST to see how the US closed, how Asia is trading and what GIFT Nifty is pointing to.
On this page
Where is it and do I need a plan?
It is Global Markets in the side menu. You need to log in. There is no plan requirement.
What do the four tiles at the top show?
- GIFT Nifty · NIFTY Fut: both prices with their percentage change, and a line like "GIFT +42.50 vs Fut" showing the gap between them. The NIFTY Futures price comes from AOC's own live feed; if it is not available, the tile shows a dash.
- Breadth: how many indices are up and down, a green/grey/red bar, and the average change across all of them.
- Top gainer and Top loser: the biggest percentage move each way, with the index name.
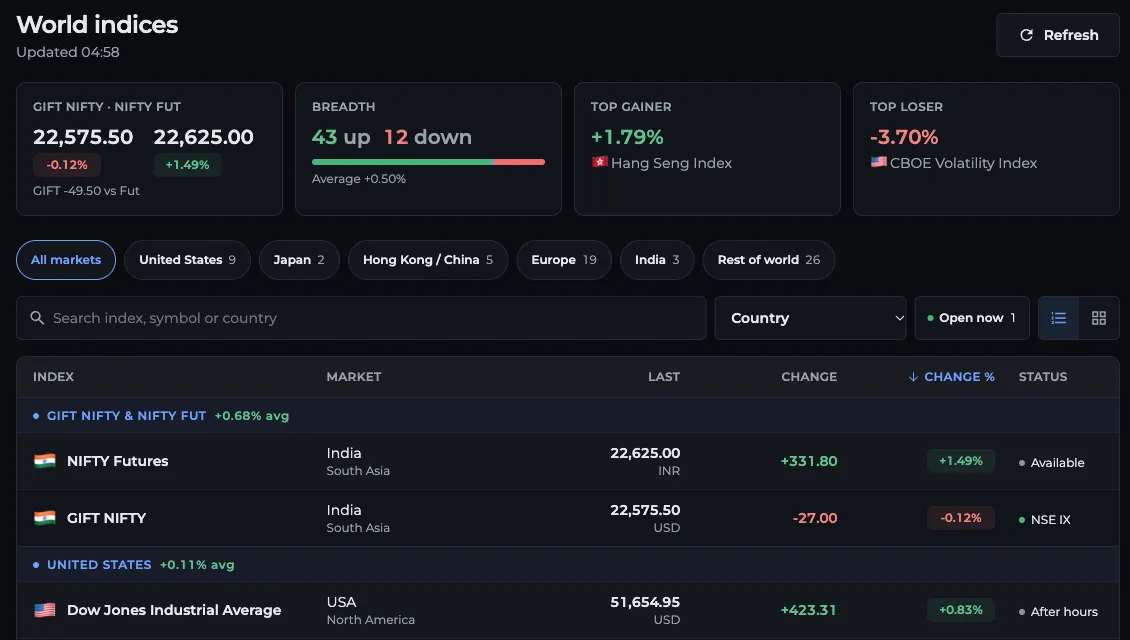
- 1GIFT Nifty vs NIFTY Fut tile
- 2Region chips, e.g. United States
- 3Search, Country and Open now
- 4Table or heatmap view
- 5Status: Open, Pre-market, After hours, Closed
How do I check global cues before the open?
- Open Global Markets and read the GIFT Nifty tile. A GIFT price 60 points above NIFTY Fut points to a positive start, though it can change by 09:15.
- Tap the United States chip and check the S&P 500, NASDAQ 100 and the CBOE Volatility Index.
- Tap Japan and Hong Kong / China for how Asia is trading right now. Turn on Open now to see only markets that are in session.
- Switch to the heatmap view for a quick colour read of the whole board.
- Then open the live option chain once the Indian market opens and see whether option writers agree with the cue.
How are the indices grouped?
Rows are grouped as GIFT NIFTY & NIFTY Fut, United States, Japan, Hong Kong / China, Europe, India and Rest of world. Each group header shows its average change. The chips across the top filter to one group and show how many indices it has; All markets brings everything back.
Inside each group the default order is Change % from highest to lowest. Tap Index, Last, Change or Change % in the table header to sort by that column, and tap again to flip it.
What do the table, heatmap and status mean?
The table shows Index, Market (country and region), Last with currency, Change, Change % and Status. On a phone some columns fold into the first and last column to fit.
The heatmap shows each index as a tile. Green is up, red is down, and the colour gets stronger with the size of the move, up to about 3%. Your choice of table or heatmap is remembered in this browser.
Status reads Open, Pre-market, After hours or Closed. A green dot means the market is trading now.
How do search and filters work?
The search box matches index name, symbol or country. The Country menu narrows to one country, and Open now keeps only markets in session. Clear resets all of them.
Prices refresh every 5 minutes while the tab is open (the data behind the page updates on that same cycle), and catch up when you come back to the tab. The Updated time shows when the data was last fetched.
Frequently asked questions
Where can I see GIFT Nifty in AOC?
Open Global Markets from the side menu. The first tile shows GIFT Nifty next to NIFTY futures, with each one's change and the point gap between them.
How often do world indices update in AOC?
Every 5 minutes. The page refreshes on that cycle while the browser tab is visible and catches up when you return to the tab.
Which world indices does AOC show?
65 indices including the S&P 500, Dow Jones, NASDAQ, Nikkei 225, Hang Seng, Shanghai Composite, KOSPI, FTSE 100, DAX, CAC 40 and GIFT Nifty, plus NIFTY futures from AOC's live feed.
Is the Global Markets page free?
Yes, it only needs a login. There is no plan requirement for world indices.
Last updated