Market data
Market Overview: NIFTY Market Bias From Option Data
Market Overview in AOC is a one-screen market bias reading: it scores NIFTY option data, five major indices and sector breadth together and shows the result as Strong Bullish, Bullish, Neutral, Bearish or Strong Bearish with a percentage. Check it before you open the live option chain, so you know which way the broad market is leaning before you read a single strike.
On this page
What does Market Overview show?
Regular accounts see two panels. The Market Bias card has a ring with the current reading, the bias label in big text, a Current box with the percentage and a T-15 change box that shows how many points the bias moved in the last 15 minutes (with "was 58%" style text under it).
Next to it, Intraday Trend plots the bias through the day on a 0% to 100% scale, with dashed lines at 25%, 40%, 60% and 75% marking the bands. The pills at the top show Now and Change since the first point of the day.
The card also says the detailed dashboard is for admin and mentor accounts only. That longer view adds the signal-by-signal breakdown; the bias number itself is the same for everyone.
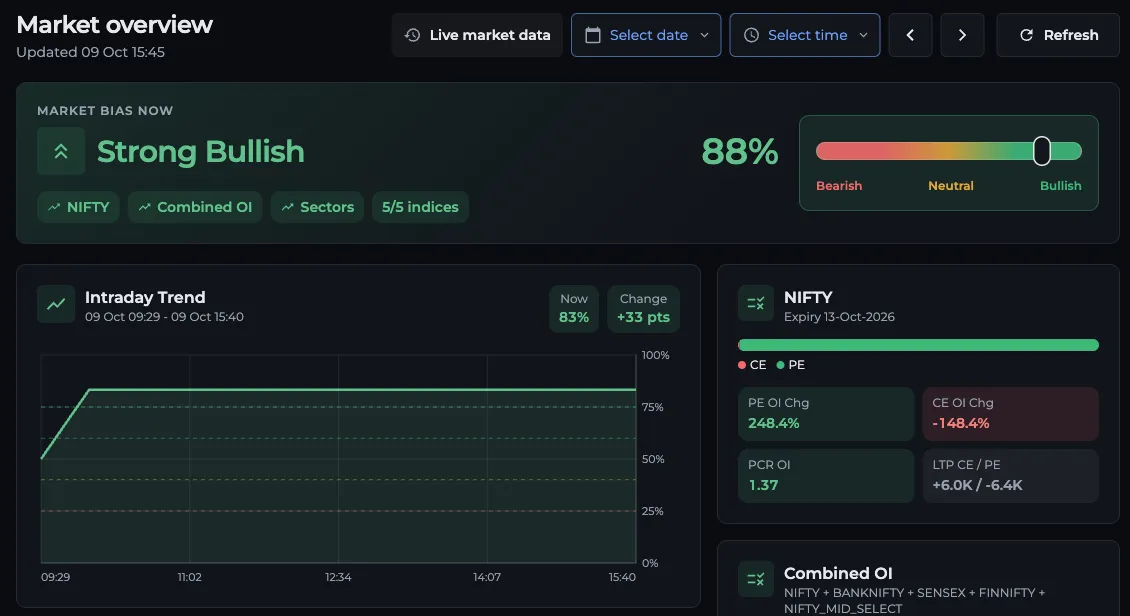
Admin and mentor accounts see this detailed layout; the bias number is the same for everyone.
- 1Bias label and percentage
- 2Bearish to Bullish scale
- 3Intraday Trend on a 0% to 100% scale
- 4Now and Change pills
How is the market bias calculated?
AOC scores up to eight signals. Each one reads +1 (bullish), 0 (neutral) or -1 (bearish), and the total is turned into a percentage where 50% is perfectly neutral.
- PE OI Chg% (NIFTY and Combined): the puts' share of the total change in open interest. 60% or more reads bullish (put writers adding faster), 40% or less reads bearish.
- PCR OI (NIFTY and Combined): total put OI divided by total call OI. Above 1.2 reads bullish, below 0.8 bearish. See PCR for why.
- LTP Chg (NIFTY and Combined): call premiums rising while put premiums fall, with the call move bigger, reads bullish. The reverse reads bearish.
- Sector count: 9 or more sector indices in the green reads bullish, 9 or more in the red reads bearish.
- Stock breadth: advancing stocks across the sector indices. 55% or more advancing reads bullish, 45% or less bearish.
What is Combined OI?
Combined adds up the option data of NIFTY, BANKNIFTY, SENSEX, FINNIFTY and MIDCAP SELECT, each on the expiry its live chain is showing, and runs the same three OI signals on the total. It stops one index from dominating the picture.
If an index fails to load, the score is built from whatever did load. On a normal day all five come through.
How do I read the percentage?
The bands are: 75% and above Strong Bullish, 60% to 74% Bullish, 40% to 59% Neutral, below 40% Bearish, and 25% or lower Strong Bearish.
One thing trips people up. On the bearish side the number shows strength, not the raw score. If three more signals are bearish than bullish, the raw reading is about 31%, and the card shows 69% Bearish. Three more bullish signals show 69% Bullish. Always read the label with the number.
The ring colour follows the same logic: green for bullish, amber for neutral, red for bearish.
How do I use it before a trade?
- Open Market Overview from the side menu (it is also the Market Overview card on the home screen).
- Read the bias label and percentage on the Market Bias card.
- Check T-15 change. A Bullish reading that dropped 25 points in 15 minutes is a very different market from one that just climbed.
- Look at Intraday Trend to see whether the bias has been steady since the morning or keeps flipping across the 40% to 60% band.
- Open the live option chain for the index you trade and confirm the strike-level picture before you enter.
How often does it update?
The page reloads its data every 30 seconds while the browser tab is visible, and pauses when you switch away. The Updated time under the heading shows the IST timestamp of the latest data. You can force a reload with the refresh button.
The Intraday Trend chart keeps one point per 15 minutes, so a sudden swing in the last couple of minutes shows in the card before it shows on the chart. The trend line is built from the NIFTY and Combined OI signals; the sector signals feed the card but not the line.
Who can use Market Overview?
You need to be logged in and have AOC Pro, because it runs on live option data. Without a plan the page shows the plans instead. See pricing for what each plan includes.
Market Overview is an analysis tool, not investment advice. A bullish reading tells you what option writers and breadth look like right now, not where NIFTY will close.
Frequently asked questions
What is market bias in AOC?
Market bias is a single reading built from NIFTY option OI, the combined OI of five indices and sector breadth. It is shown as Strong Bullish, Bullish, Neutral, Bearish or Strong Bearish with a percentage, and updates every 30 seconds.
Why does Market Overview say 70% when the market is bearish?
On the bearish side AOC shows the strength of the bearish reading, so a raw score of 30% is displayed as 70% Bearish. Read the label together with the number. 70% Bullish and 70% Bearish are opposite readings.
What does T-15 change mean?
T-15 change is how many points the bias moved compared with 15 minutes earlier. A positive number means the market turned more bullish in that window, a negative one more bearish.
Which indices are used in Combined OI?
Combined OI adds NIFTY, BANKNIFTY, SENSEX, FINNIFTY and MIDCAP SELECT together, each on the expiry its live option chain is showing. The same PE OI change, PCR and premium change rules are then applied to the total.
Is Market Overview free?
No. It needs a login and AOC Pro because it uses live option data. Free accounts see the plans page when they open it.
Last updated